Sales gains for homes priced above $600,000 offset declines at the lower end of the market, resulting in October sales that were similar to last year. The 2,174 sales in October increased over September and stood 24 per cent above long-term trends for the month.
Housing demand has stayed relatively strong in our market as we move into the fourth quarter, with October sales rising over last month,” said Ann-Marie Lurie, Chief Economist at CREB®. “However, activity would likely have been stronger if more supply choices existed for lower-priced homes. Supply levels in our market are improving relative to the ultra-low levels experienced last year, but much of the gains have been driven by higher-priced units for each property type. This results in conditions far more balanced in the upper end of the market versus the seller's market conditions in the lower to mid-price ranges of each property type.
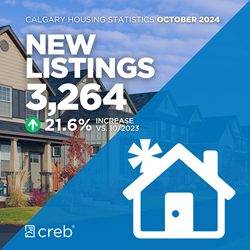
The gains in new listings relative to sales over the past six months have supported inventory gains in the city. As of October, 4,966 units were available, a significant improvement over the near-record low of 3,205 units reported last October. While inventories are starting to reach levels more consistent with long-term trends, the inventory composition has changed as nearly half of all the residential inventory is now priced above $600,000.
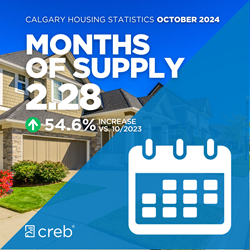
Adjustments in supply are helping move the market away from the tight market conditions experienced in the spring. However, conditions remain relatively tight, with 2.3 months of supply and a 67 per cent sales-to-new listings ratio, and the months of supply does vary significantly by price range and property type. For example, detached homes priced below $700,000 are reporting less than two months of supply, while homes priced over $1,000,000 are reporting over three months of supply. This is likely resulting in different price pressures depending on price range and property type.
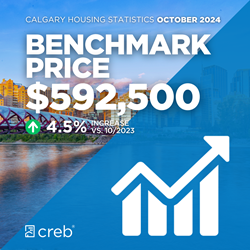
Overall, the total residential benchmark price was $592,500 in October, over four per cent higher than last October and on a year-to-date basis, averaging over eight per cent higher than last year's levels. The unadjusted benchmark prices did ease slightly over last month due to seasonal factors, as seasonally adjusted prices remained relatively stable in October compared to September.
To read the full stats release on October's housing market for Calgary and surrounding areas, click here.
October 2024 housing market snapshot
(Shareable social media images - click on the images to enlarge and save)
Click here to view the full City of Calgary monthly stats package.
Click here to view the full Calgary region monthly stats package.
Members can also access a wide range of housing data tools and dashboards on CREB®Link.
Discover more insights at CREB®'s Forecast Conference!
Don’t miss your chance to learn from the best and connect with industry leaders. Secure your spot today at crebforecast.com.


{ 0 comments…}