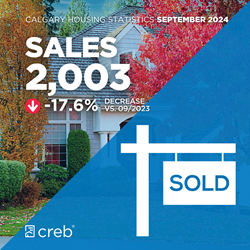
Rising sales in the upper price ranges were not enough to offset the pullback occurring in the lower price ranges, as sales in September were 2,003, 17 per cent below last year's record high. Despite the decline, sales this month were still over 16 per cent higher than levels traditionally achieved in September.
“We are starting to see a rise in new listings in our market. However, most of the listing growth is occurring in the higher price ranges,” said Ann-Marie Lurie, Chief Economist at CREB®. “While demand has stayed strong across all price ranges, the limited choice for lower-priced homes has likely prevented stronger sales in our market. While the challenges in the lower price ranges are not expected to change, improved supply combined with lower lending rates should keep demand strong throughout the fall, but without the extreme seller market conditions that contributed to the rapid price growth earlier this year.”
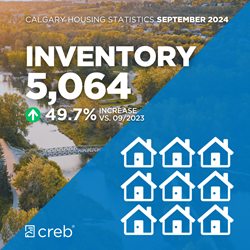
New listings in September rose to 3,687 units, the highest September total since 2008. This rise in new listings compared to sales did support some inventory growth. September inventory levels pushed up to 5,064 units, nearly double the exceptionally low levels reported in the spring, but remain below the 6,000 units we typically see in September.
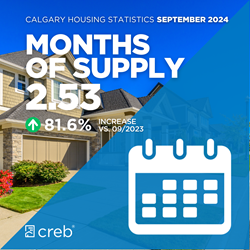
Improving inventory levels compared to sales is continuing to shift our market toward more balanced conditions. In September, the months of supply reached 2.5 months. While this is a gain over last year’s record low, conditions are still tilted in favour of the seller.
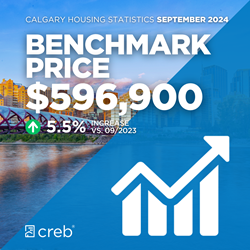
Additional supply in the market has taken some of the pressure off home prices over the past few months, following stronger-than-expected gains throughout the spring. In September, the unadjusted benchmark price was $596,900, slightly lower than last month but over five per cent higher than last year’s levels. Year-over-year gains ranged from nearly nine per cent growth for detached homes to nearly 14 per cent gains in the apartment condominium market. The gains for each property type outpaced the growth in total residential prices, mostly due to the shifting composition of sales.
To read the full stats release on September's housing market for Calgary and surrounding areas, click here.
September 2024 housing market snapshot
(Shareable social media images - click on the images to enlarge and save)
Click here to view the full City of Calgary monthly stats package.
Click here to view the full Calgary region monthly stats package.
Members can also access a wide range of housing data tools and dashboards on CREB®Link.


{ 0 comments…}